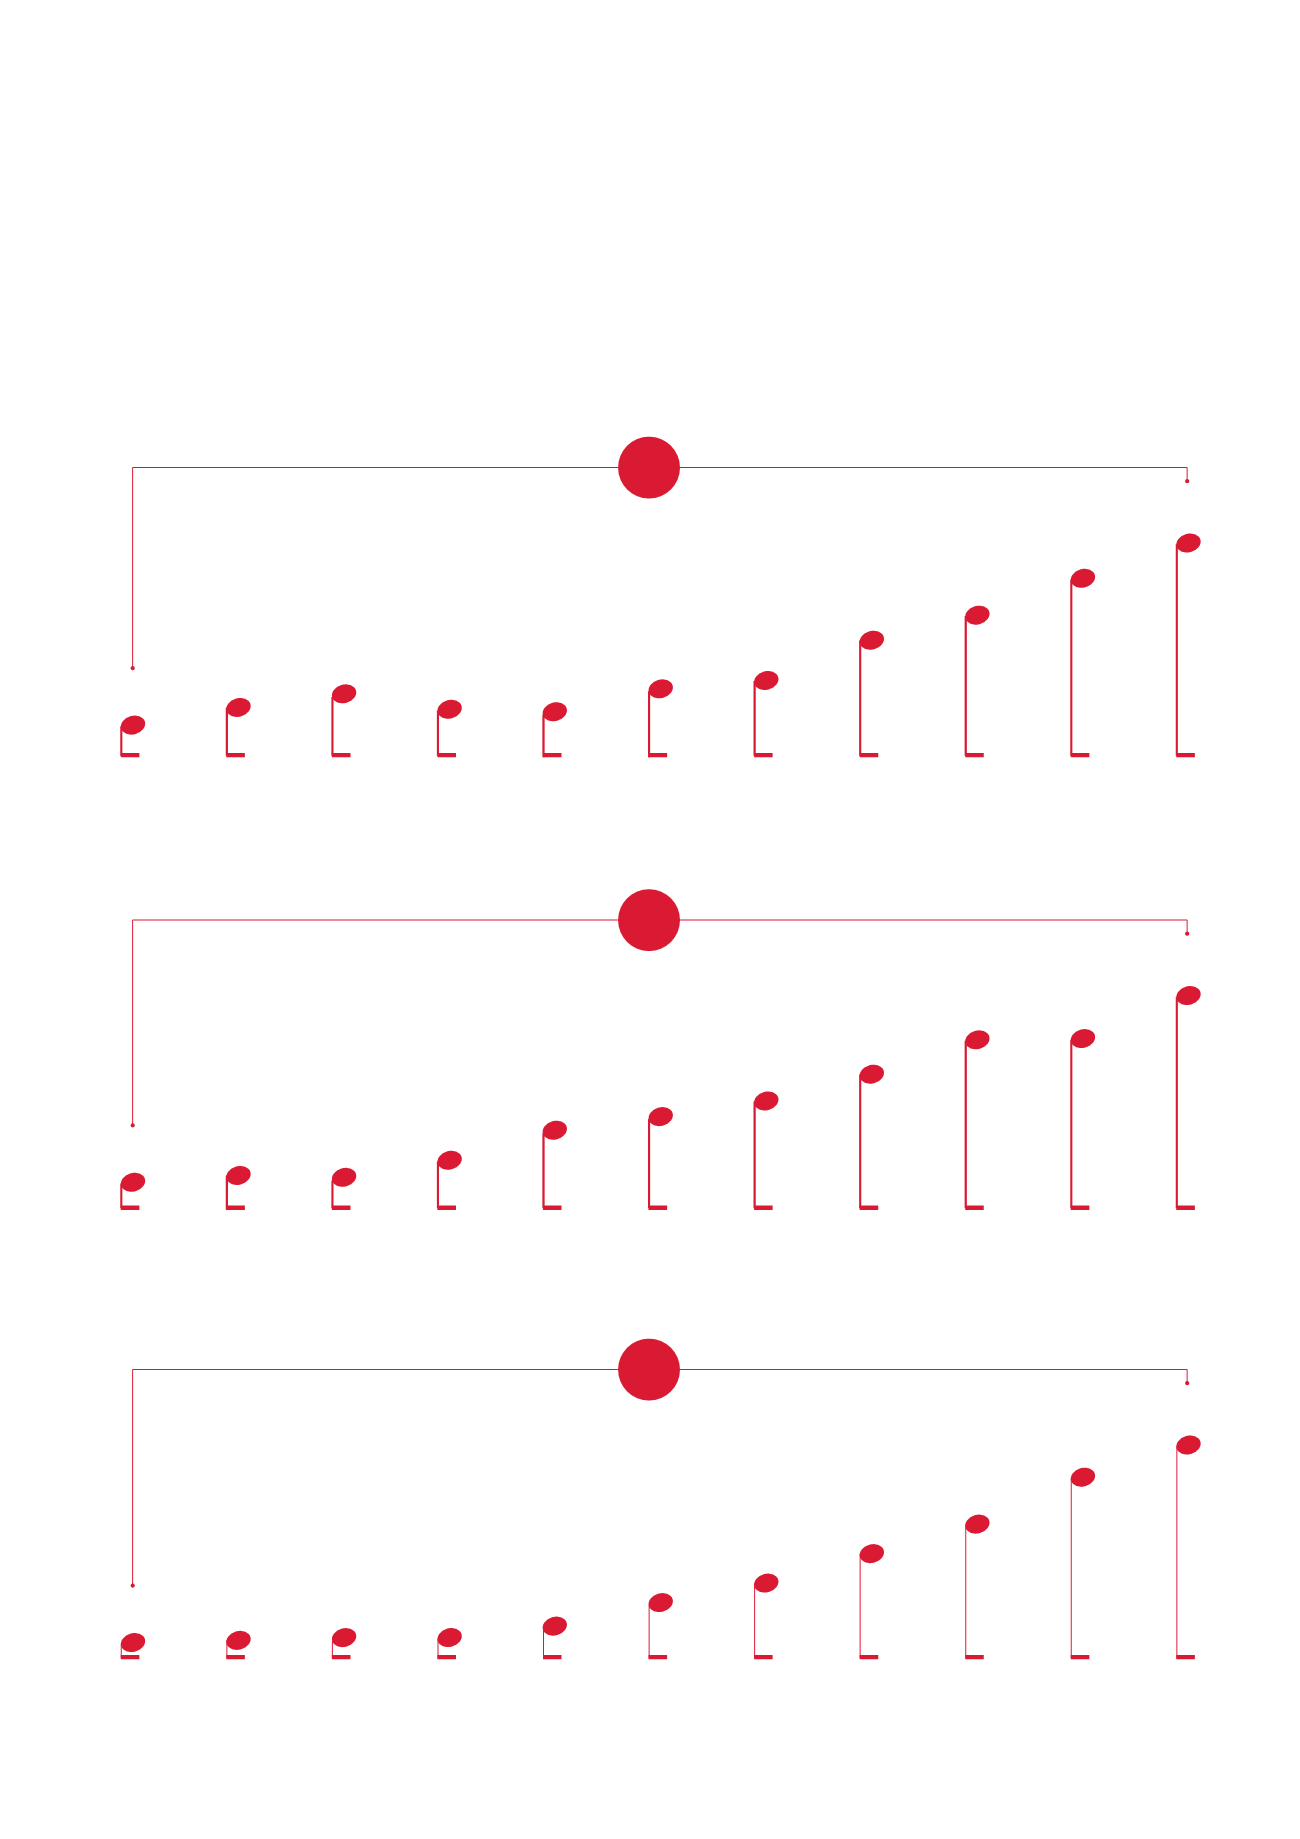

Financial Indicators - Receivables
Financial Leasing Sector - Receivables
(TL million)
2006
2008
2010
2012
2007
2009
2011
2013
2015
2016
2014
8,480
11,661
14,334
11,066
10,711
15,112
17,154
24,957
29,485
36,718
44,022
18%
CAGR
2006
2008
2010
2012
2007
2009
2011
2013
2015
2016
2014
5,107
6,223
5,610
8,351
12,370
14,213
16,328
20,096
24,715
24,994
31,027
20%
CAGR
2006
2008
2010
2012
2007
2009
2011
2013
2015
2016
2014
3,212
3,683
3,962
3,800
5,374
8,385
10,734
14,475
18,053
23,825
27,855
24%
CAGR
Factoring Sector - Receivables
(TL million)
Financing Sector - Receivables
(TL million)
Annual Report 2016
The Association of Financial Institutions
22


